 ar
ar bg
bg hr
hr cs
cs da
da nl
nl fi
fi fr
fr de
de el
el hi
hi it
it ko
ko no
no pl
pl pt
pt ro
ro ru
ru es
es sv
sv tl
tl iw
iw id
id lv
lv lt
lt sr
sr sk
sk sl
sl uk
uk vi
vi et
et hu
hu th
th tr
tr fa
fa ms
ms hy
hy ka
ka ur
ur bn
bn mn
mn ta
ta kk
kk uz
uz ku
ku
Visualization Software
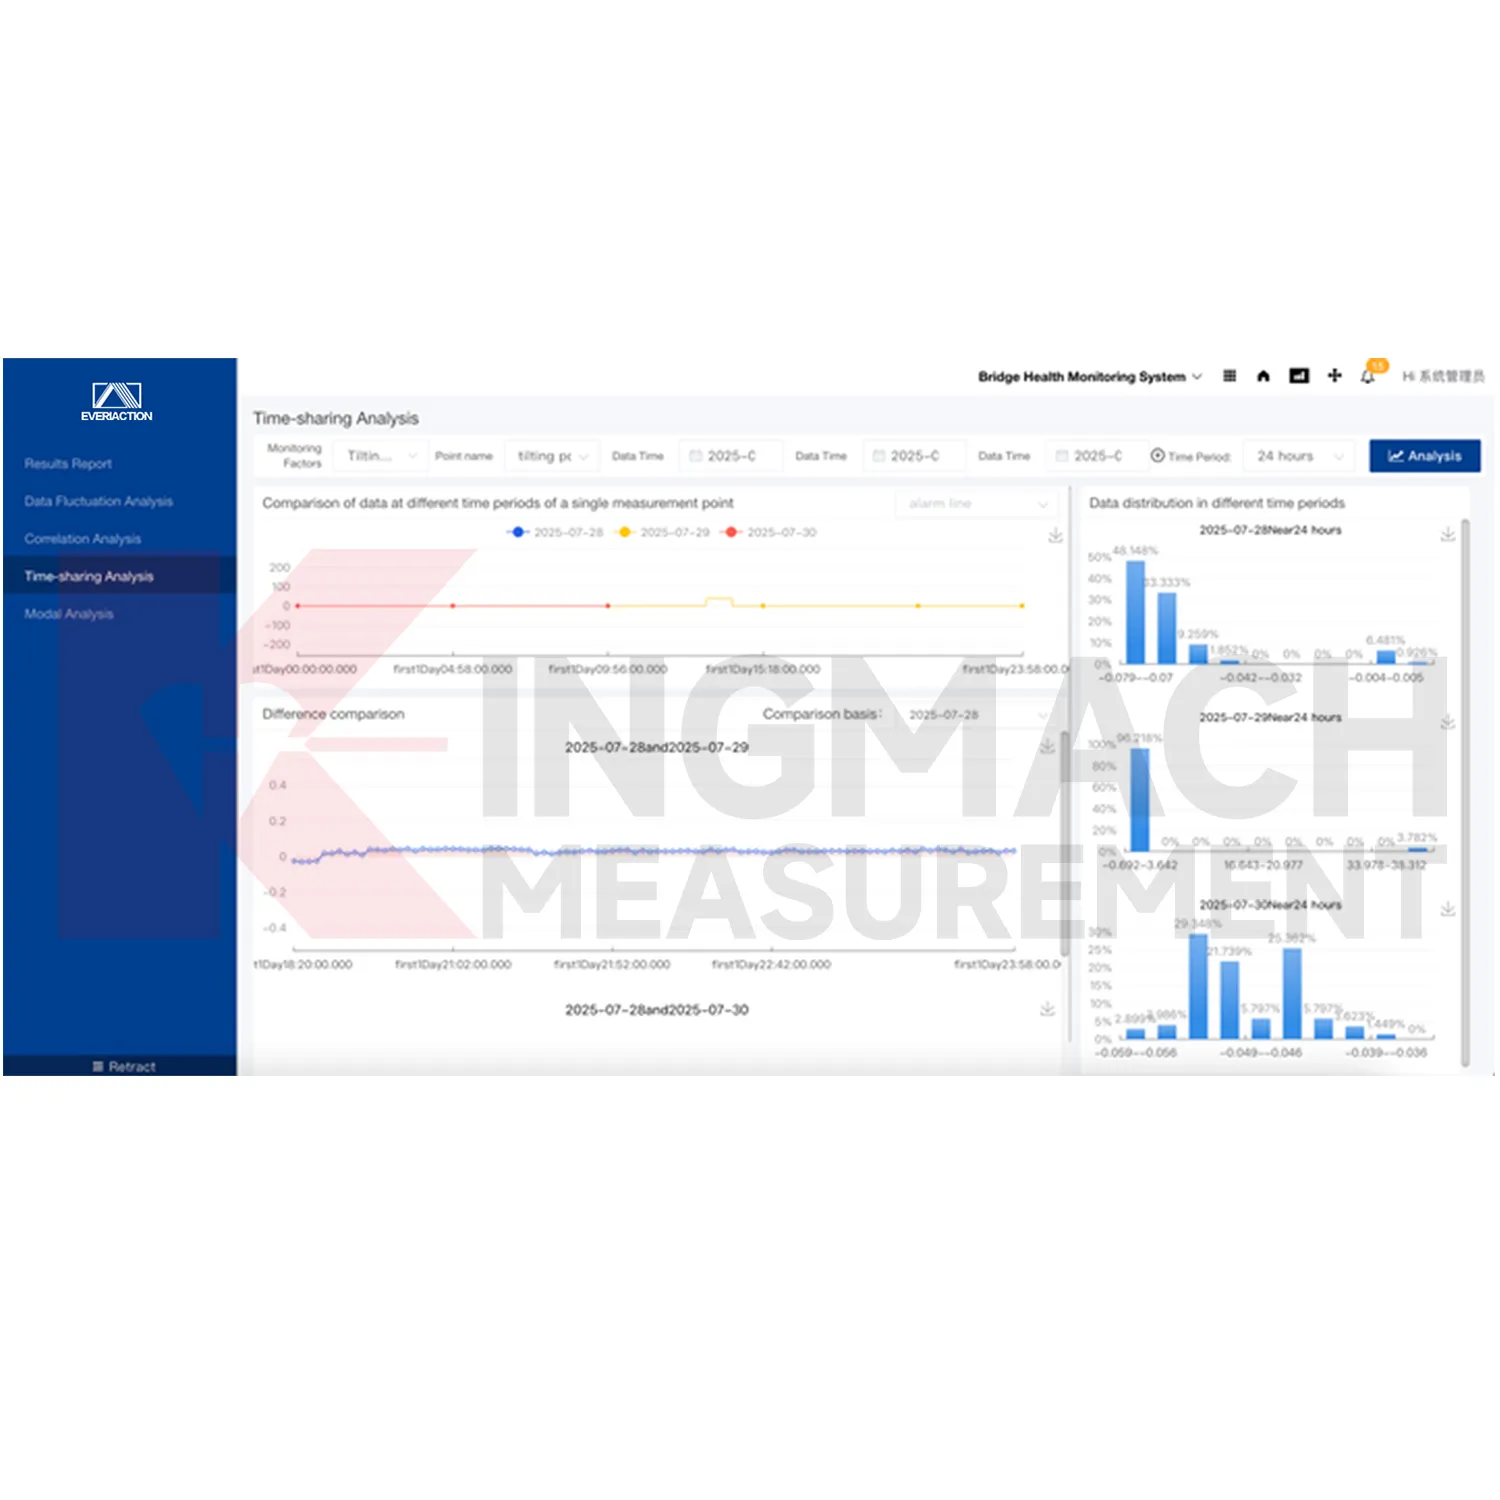
Kingmach Visualization Software refers to the Monitoring system software platform, also described in the local files as the Cloud Platform. It is based on Internet of Things, big data, and cloud computing technologies for all-round monitoring of civil engineering structure safety. The platform receives data from monitoring devices, stores it, filters it, analyzes it, displays it, and supports project management. It is intended for infrastructure and engineering assets where multi-source readings need to be reviewed together instead of scattered across separate devices or spreadsheets.
Application of Visualization Software
Foundation pit monitoring uses Kingmach Visualization Software to coordinate support force, displacement, settlement, groundwater, tilt, and environmental records during construction. Pit sites change quickly, and data must be reviewed alongside excavation stage, support installation, rainfall, pumping, and nearby building response. Flexible alarm rules help the team distinguish routine stage-related movement from a reading that needs inspection. Project documents and dynamic information also help later reviewers understand what was happening when a trend changed.
The future of Visualization Software
Standardized project records will shape the future of Kingmach Visualization Software. Infrastructure owners increasingly need monitoring data that can survive staff changes, contractor changes, upgrades, and long asset lifetimes. A project-based platform can keep baseline data, device information, inspection notes, alarm levels, and documents in a consistent structure. That record becomes useful years later when teams compare new behavior with earlier conditions and decide whether maintenance or deeper investigation is required.
Care & Maintenance of Visualization Software
Alarm rules in Kingmach Visualization Software should be reviewed by engineering staff, not copied blindly across every point. Different structures, sensors, and risk levels need different alarm logic. A settlement point, strain point, water-level point, and tilt point may require different thresholds, rate checks, and response procedures. After the first operating period, review alarm history and adjust rules where ordinary behavior is creating unnecessary alerts or where a critical pattern needs faster attention.
Kingmach Visualization Software
Kingmach Visualization Software makes reporting easier because monitoring evidence is already organized by project, device, channel, trend, alarm, and document. Registered experts can issue professional result reports through the platform workflow described in the local product file. For owners, reports need to explain what changed, where it happened, which instruments confirmed it, and what field action followed. A platform that stores data, filters records, generates visual trends, and keeps project documents together makes that reporting process more traceable than manual consolidation after the event.
FAQ
Q: How are trend curves used?
A: They help compare current readings with earlier behavior so gradual movement, sudden jumps, or event response can be reviewed.
Q: What does real-time filtering help with?
A: It reduces noisy or distracting records before users study the channel history.
Q: How do alarms guide action?
A: Configured rules point users toward the affected point, severity level, time, and related follow-up record.
Q: What makes reports easier?
A: Stored trends, alarms, project files, and expert review notes can be gathered without rebuilding the evidence manually.
Q: Why is graphical display useful?
A: Graphs help users see movement direction, timing, and abnormal patterns faster than raw tables alone.
Reviews
Robert Taylor
The weir flow meter is well-built and delivers accurate measurements. Great value for water management applications.
Michael Anderson
The strain gauges and load cells are extremely accurate and stable. They performed very well in our bridge monitoring project. Highly recommended!
Latest Inquiries
To protect the privacy of our buyers, only public service email domains like Gmail, Yahoo, and MSN will be displayed. Additionally, only a limited portion of the inquiry content will be shown.
Charlotte***@gmail.comUnited Arab Emirates
Hi, we require instrumentation cables suitable for harsh environments. Could you advise on specifica...
Harper***@gmail.comIndia
Dear Sir, we are planning to procure a complete monitoring system including strain gauges, tiltmeter...
Related product categories
- Monitoring Software Suite
- Monitoring system software platform
- Environmental Monitoring
- Visualization Software
- GPS Displacement Monitoring System
- Integrated Monitoring Station
- Settlement Monitoring Rod
- Structural Health Monitoring (SHM) System
- Structural Monitoring Cloud Platform
- IoT Online Monitoring System
- Monitoring System Platform & Services
- Engineering Pulse Intelligent Monitoring Cloud Platform